102 AI search and GEO statistics | November 2026
AI is already sending visitors to websites. In September 2026, 79.2% of the websites studied by SE Visible received at least one AI visit. The company tracked 28,500 sites that received organic search traffic throughout the study. Even a single visit counted, so this tells us how widely AI traffic has spread, rather than how much traffic each site received. (SE Ranking / SE Visible, Nov 2026).
- Google's AI summaries appeared in 88% of the commercial searches Semrush tracked in the US in August 2026, up from 45.75% in September 2025. These summaries are called AI Overviews. (Semrush, Oct 2026).
- AI Overviews appeared in 82.5% of US brand searches and 40.4% of German brand searches, averaged across three checks in October 2026. (SE Ranking / SE Visible, Oct 2026).
- Click-through rate fell by 18.8 percentage points among users assigned to AI Mode, compared with the control group in a US experiment from March 2026. The paper was released as a preprint. (Wang et al., Aug 2026).
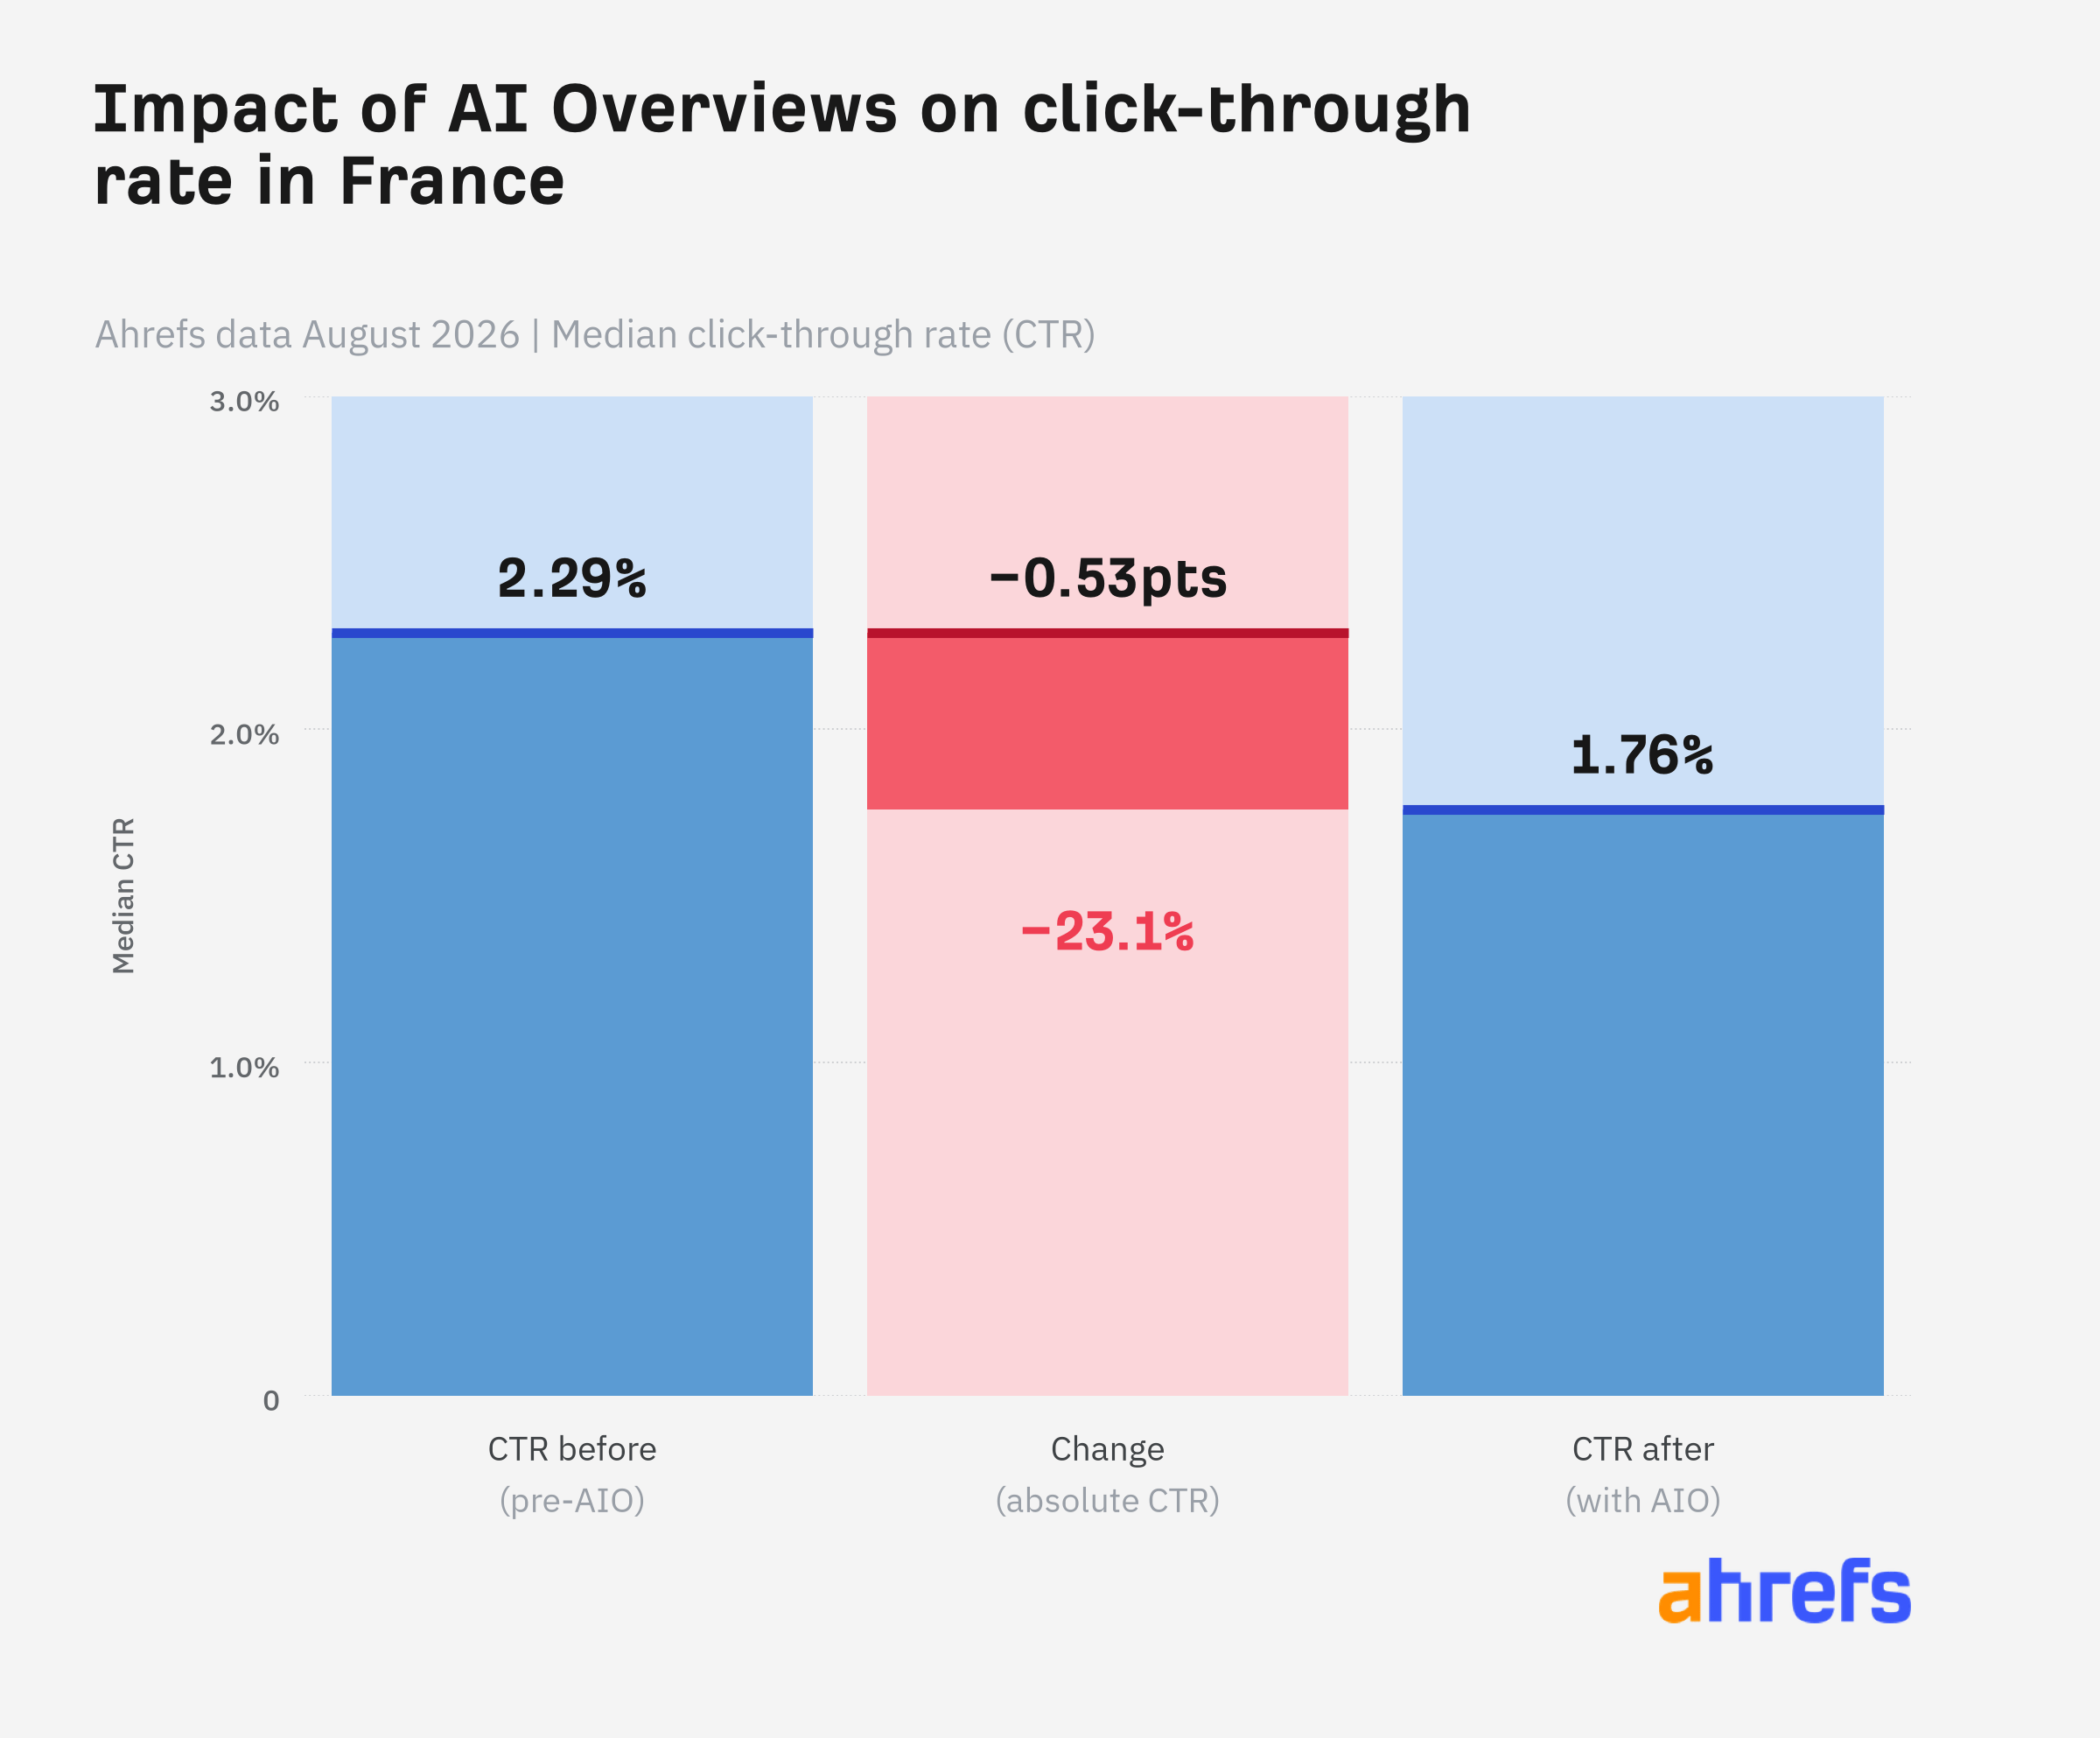
- Median click-through rate fell by 23.1% among French sites with high exposure to AI Overviews. This was a relative change around the July 2026 launch, before adjustment against a control group. (Ahrefs, Sep 2026).
- Visitors arriving from AI converted at a rate 48% higher than visitors from other sources at the US retail sites Adobe measured in August 2026. (Adobe Digital Insights, Sep 2026).
- Each AI visit generated 43% more revenue on average than a visit from another source, at those retail sites in the same month. (Adobe Digital Insights, Sep 2026).
- 62.2% of AI Overview links to brand websites pointed to pages outside the top ten organic results, in the US brand searches studied in October 2026. (SE Ranking / SE Visible, Oct 2026).
- Brands mentioned more often on Reddit also tended to appear more often in AI answers, with a correlation of about 0.75 in an Ahrefs study. It was published in November 2026, but does not state when the data was collected. (Ahrefs, Nov 2026).
- News and editorial sites' share of source links fell from 31.1% to 26.8% between the first and second halves of October 2026 in Meltwater's sample. Most of the decline came from a change in Perplexity. (Meltwater, Nov 2026).
- 59% of the websites ChatGPT cited on the first day were absent the next day, in an Ahrefs study published in October 2026. The study does not give the dates of its main tracking period. (Ahrefs, Oct 2026).
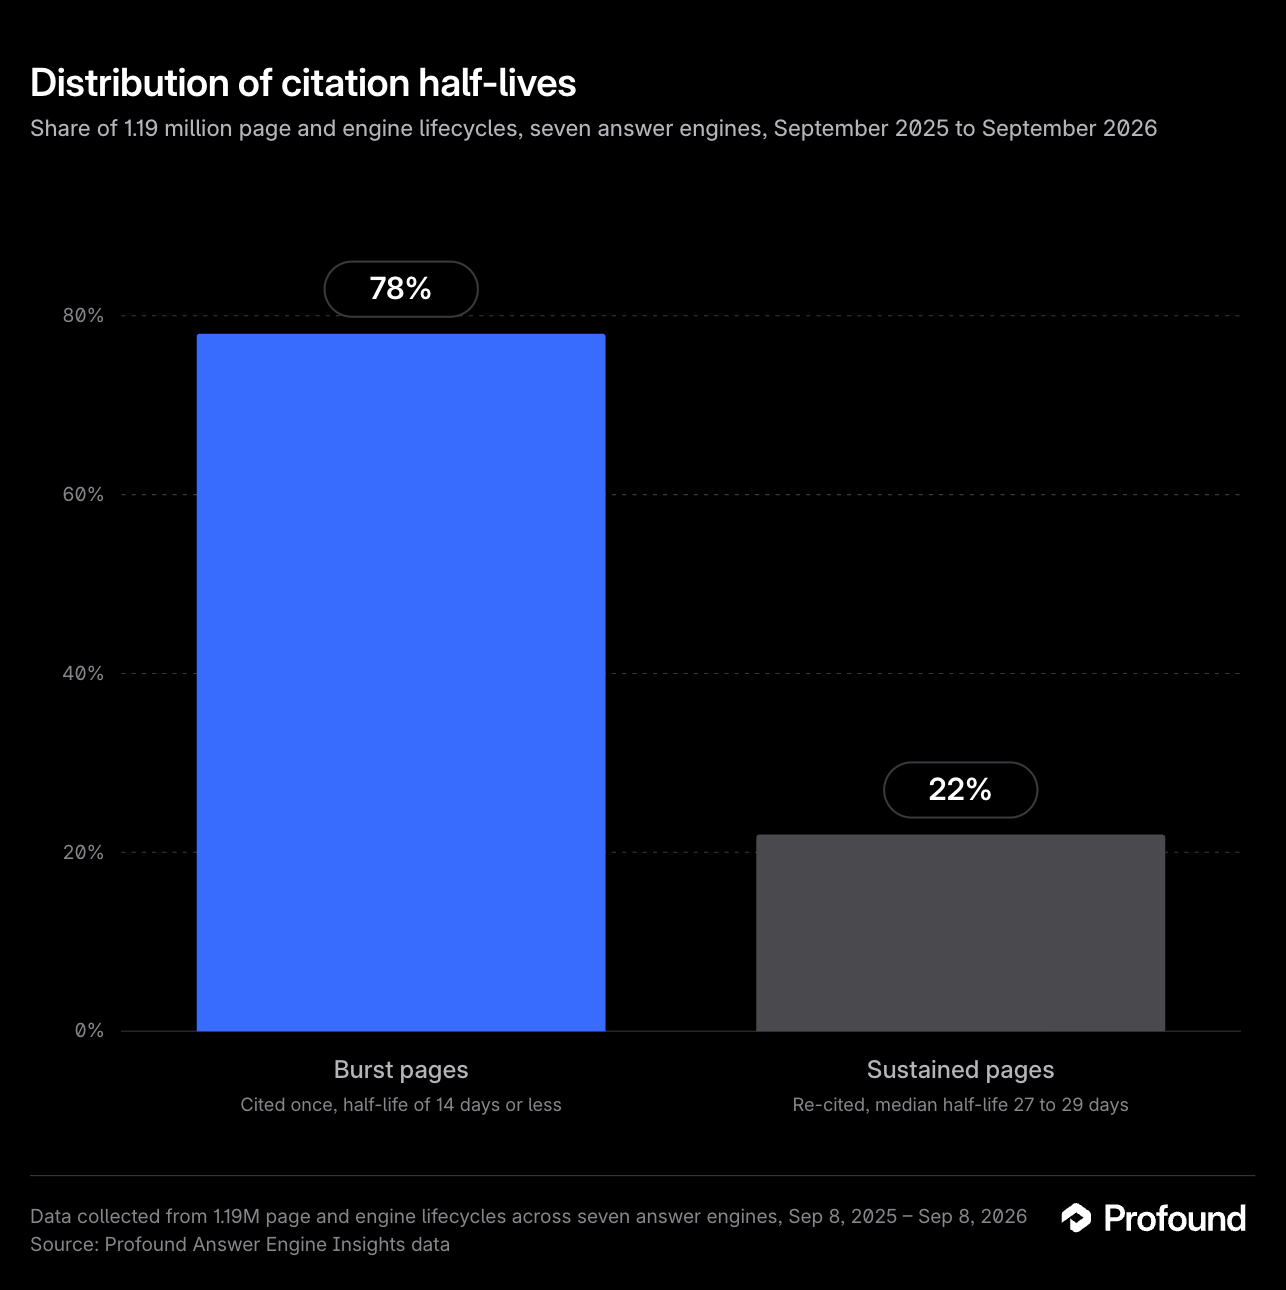
- A page's share of citations fell to half its peak after a median of 11 days, in Profound's study covering September 2025 to September 2026. The clock starts at peak visibility, not the page's publication date. (Profound, Sep 2026).
- 0.46% of visits to the websites studied came from AI assistants, according to Ahrefs Web Analytics data for October 2026. This measures traffic to sites using the tool. (Ahrefs, Nov 2026).
To understand what this means for your business, look at what happens next. Do people click the link? Do they buy? Does your brand keep appearing in answers over time? This article brings together findings from the first search through to the website visit.
Each finding links to its original study. Most of the research took place outside Israel, so use it as a starting point for checking your own audience. When we say an AI system “cites” a website, we mean that it links to the site as a source for its answer.
Where do AI answers appear during a purchase?
Check what people see when they compare products, read reviews or look up a price. These searches help them choose, and an AI summary may be part of the answer they read.
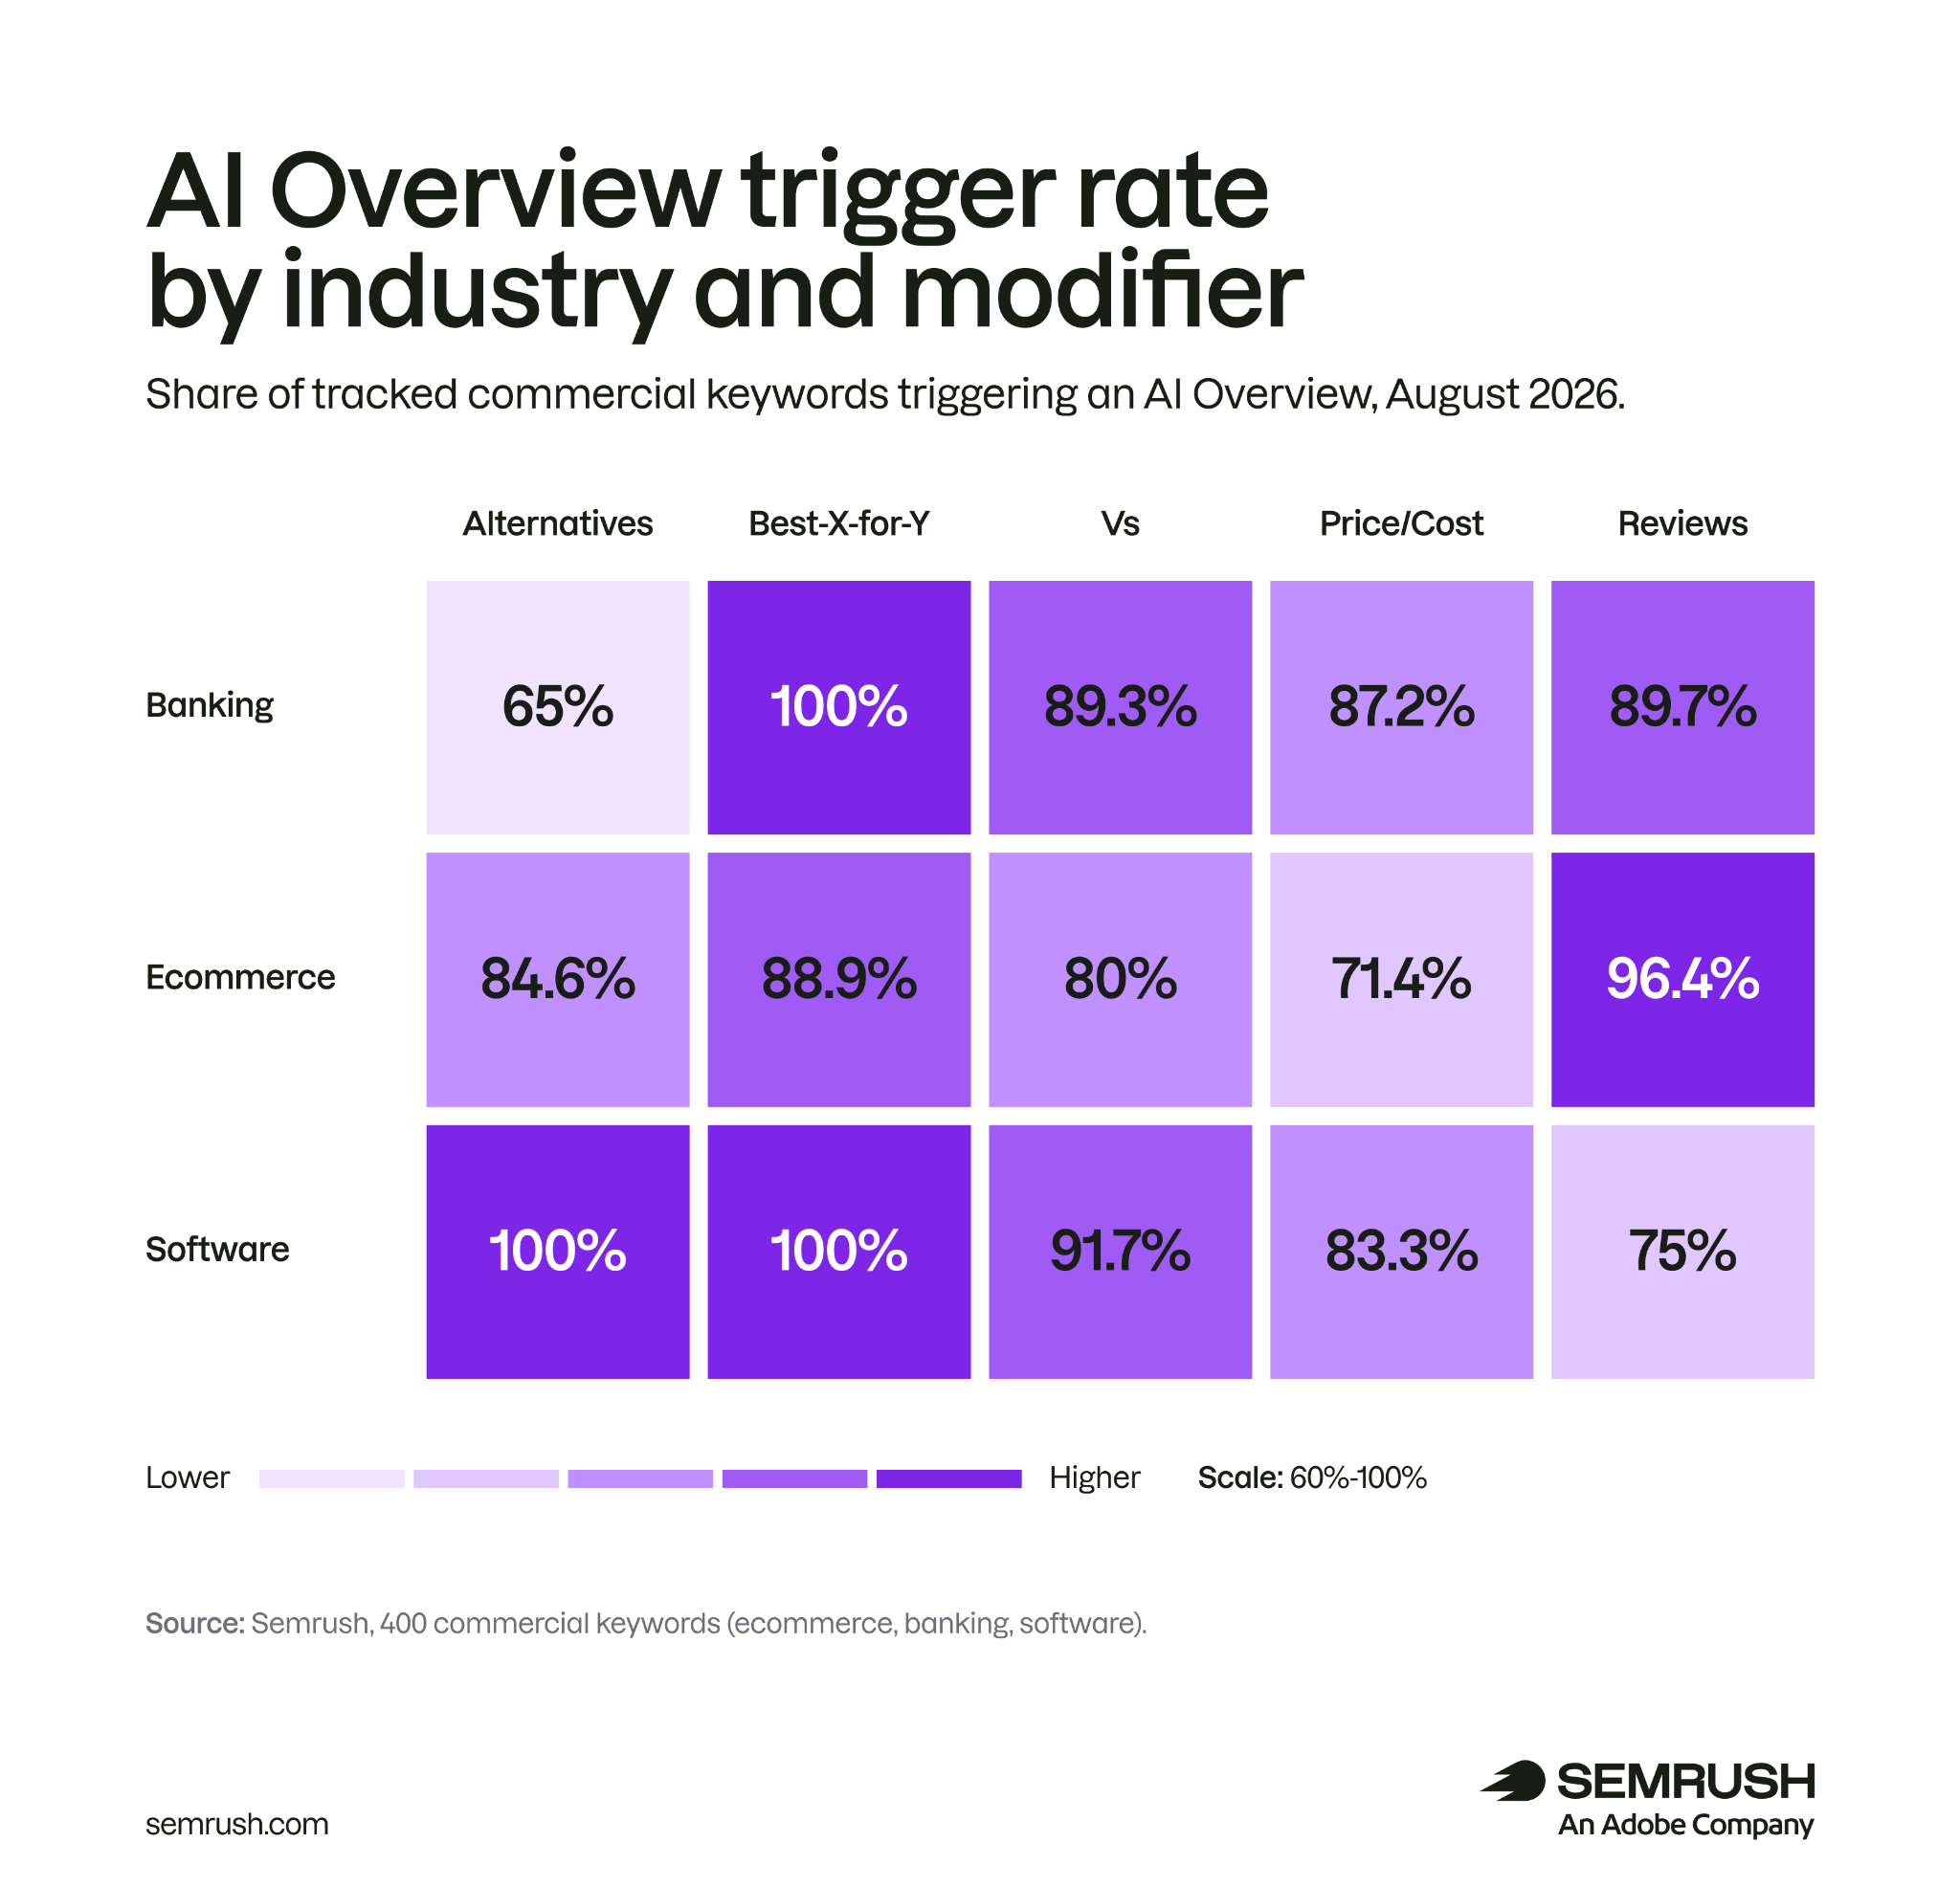
How common are AI Overviews in commercial searches?
AI summaries appeared in many of the searches Semrush checked. The researchers tracked which queries showed a summary and also used estimates of how often people searched for each query.
- When more popular queries carried more weight, AI Overview coverage reached 97.08% in August 2026. (Semrush, Oct 2026).
- For ecommerce searches, coverage rose from 32.62% to 85.11% over the study period. (Semrush, Oct 2026).
- In 12 of 15 groups, divided by industry and question type, an AI summary appeared in at least 80% of searches in August. (Semrush, Oct 2026).
Semrush followed the same list of 400 US desktop searches across banking, software and ecommerce. A fixed list helps show change over time, but it does not represent every Google search.
For your site, start with the searches that matter to customers. Check which show an AI summary and how often people search for them. Use the language, country and device that match your audience.
Which comparison and alternative searches get AI answers?
AI summaries also appeared when people searched for information to help them choose a product. Here is what Semrush found by August 2026:
| What people searched for | How often an AI summary appeared |
|---|---|
| A product for a particular need: Best X for Y | 96.12% of searches. (Semrush, Oct 2026). |
| Alternatives | Above 82% of searches, according to the study's text. (Semrush, Oct 2026). |
| Reviews | Up from 30.14% to about 90% between the start and end of the period. (Semrush, Oct 2026). |
| Brand versus brand | An increase of 23.18 percentage points over the period. (Semrush, Oct 2026). |
| Ecommerce prices | Up from 4.76% to 71.43%. (Semrush, Oct 2026). |
| Software alternatives; Best X for Y in software and banking | 100% of searches in each of these groups in August. (Semrush, Oct 2026). |
If your site has a comparison page, search for the question it answers and read the AI summary. Check whether it uses your information, whether prices are current, and whether it describes the differences correctly. This helps you see what a customer learns before reaching your site.
Do brand searches behave the same way in every market?
No. SE Visible found differences between brand searches in the US and Germany. It checked each query three times in October 2026 to see whether the summary appeared again.
| What was checked | Share of searches with an AI summary |
|---|---|
| A summary in every check | US 75.6%; Germany 29.6%. (SE Ranking / SE Visible, Oct 2026). |
| A summary in only some checks | US 11.4%; Germany 22.2%. (SE Ranking / SE Visible, Oct 2026). |
| US mid-market brands | 78.7% in every check. (SE Ranking / SE Visible, Oct 2026). |
| US small and medium-sized business brands | 77.5% in every check. (SE Ranking / SE Visible, Oct 2026). |
| US enterprise brands | 70.7% in every check. (SE Ranking / SE Visible, Oct 2026). |
| US search-volume groups | 85.2% below 50,000 searches; 63.3% above one million, in every check. (SE Ranking / SE Visible, Oct 2026). |
The researchers tested a thousand queries in each country and used their own business-size categories. If you serve customers in Israel, repeat the check in Hebrew. If your customers also search in English, check that separately. The US and German results do not tell you what your customers will see.
How do AI answers change clicks to websites?
When a brand appears in an AI answer, you still need to check whether anyone clicked its link. The studies in this section address that question. Some changed the search experience in an experiment; others compared results before and after an AI Overview launch.
What happened when researchers changed the search experience?
Wang and colleagues changed participants' search experience for a week. Participants were US Chrome and Google users recruited in March 2026. Among those assigned to AI Mode, fewer people clicked through to several kinds of external website. The paper was released as a preprint in August.
- In the group where researchers tried to hide AI Overviews, the estimated increase in click-through rate was 8.8 percentage points. The 95% confidence interval was 2.3–15.3 percentage points. (Wang et al., Aug 2026).
- Among participants assigned to AI Mode, the share who clicked a news-site link fell by 12.5 percentage points. (Wang et al., Aug 2026).
- The share clicking through to Reddit fell by 21.2 percentage points. (Wang et al., Aug 2026).
- The share clicking through to Wikipedia fell by 9.9 percentage points. (Wang et al., Aug 2026).
There was a technical problem: the extension did not hide AI Overviews in every search. The researchers adjusted their calculation for this; the method is explained at the end of this article. These findings describe that experiment. They do not predict how much traffic your site will lose today.
What happened to CTR and clicks after the French launch?
Ahrefs compared website data in France before and after the launch of AI Overviews. It looked at daily clicks and click-through rate, or CTR. In the table, the median is the middle value: half the sites were above it and half below.
| What was measured | Finding |
|---|---|
| Median CTR change across the full sample | Down 5.7%. (Ahrefs, Sep 2026). |
| Median click change across the full sample | Down 8.8%. (Ahrefs, Sep 2026). |
| Sites losing more than a tenth of daily clicks | 48% of the sample. (Ahrefs, Sep 2026). |
| Sites losing more than 30% of clicks | 19% of the sample. (Ahrefs, Sep 2026). |
| Sites losing more than half their clicks | 5% of the sample. (Ahrefs, Sep 2026). |
| Highly exposed sites whose CTR fell | 82.2% of that group. (Ahrefs, Sep 2026). |
| Median click change for .fr sites | Down 12.3%. (Ahrefs, Sep 2026). |
| CTR change at sites with low AI Overview exposure | Up 2.3%. (Ahrefs, Sep 2026). |
Some sites appear in several rows, so do not add these percentages. A site losing more than half its clicks also lost more than a tenth. To understand a decline on your site, check changes in rankings, seasonality and the searches bringing visitors. This comparison alone cannot explain every cause of a decline.
Does more time searching mean more website visits?
Not necessarily. In the March experiment, users spent longer in each search session but clicked through to websites less often. These were some of the measured changes:
- For users assigned to AI Mode, a search session lasted 0.43 minutes longer on average. The 95% confidence interval was 0.20–0.66 minutes. (Wang et al., Aug 2026).
- At the same time, users had 0.92 fewer search sessions per day on average. The 95% confidence interval was a decrease of 0.55–1.30 sessions. (Wang et al., Aug 2026).
- In the group where researchers tried to hide AI Overviews, the estimate suggested sessions were 0.59 minutes shorter. A further check did not find a statistically significant result, so this finding is less robust. (Wang et al., Aug 2026).
- In the AI Mode group, the share of users who also tried a competing search engine rose by 11.2 percentage points. (Wang et al., Aug 2026).
For your business, the useful question is how many people reach your site and what they do there. More time inside a search engine does not guarantee more visits. The competing-engine result also applies to the experiment's participants; it does not measure a shift among all search users.
How much traffic comes from AI, and what is it worth?
A first visit from AI is a start. To see whether it helps the business, check whether visits continue, whether those visitors buy, and how much revenue they bring.
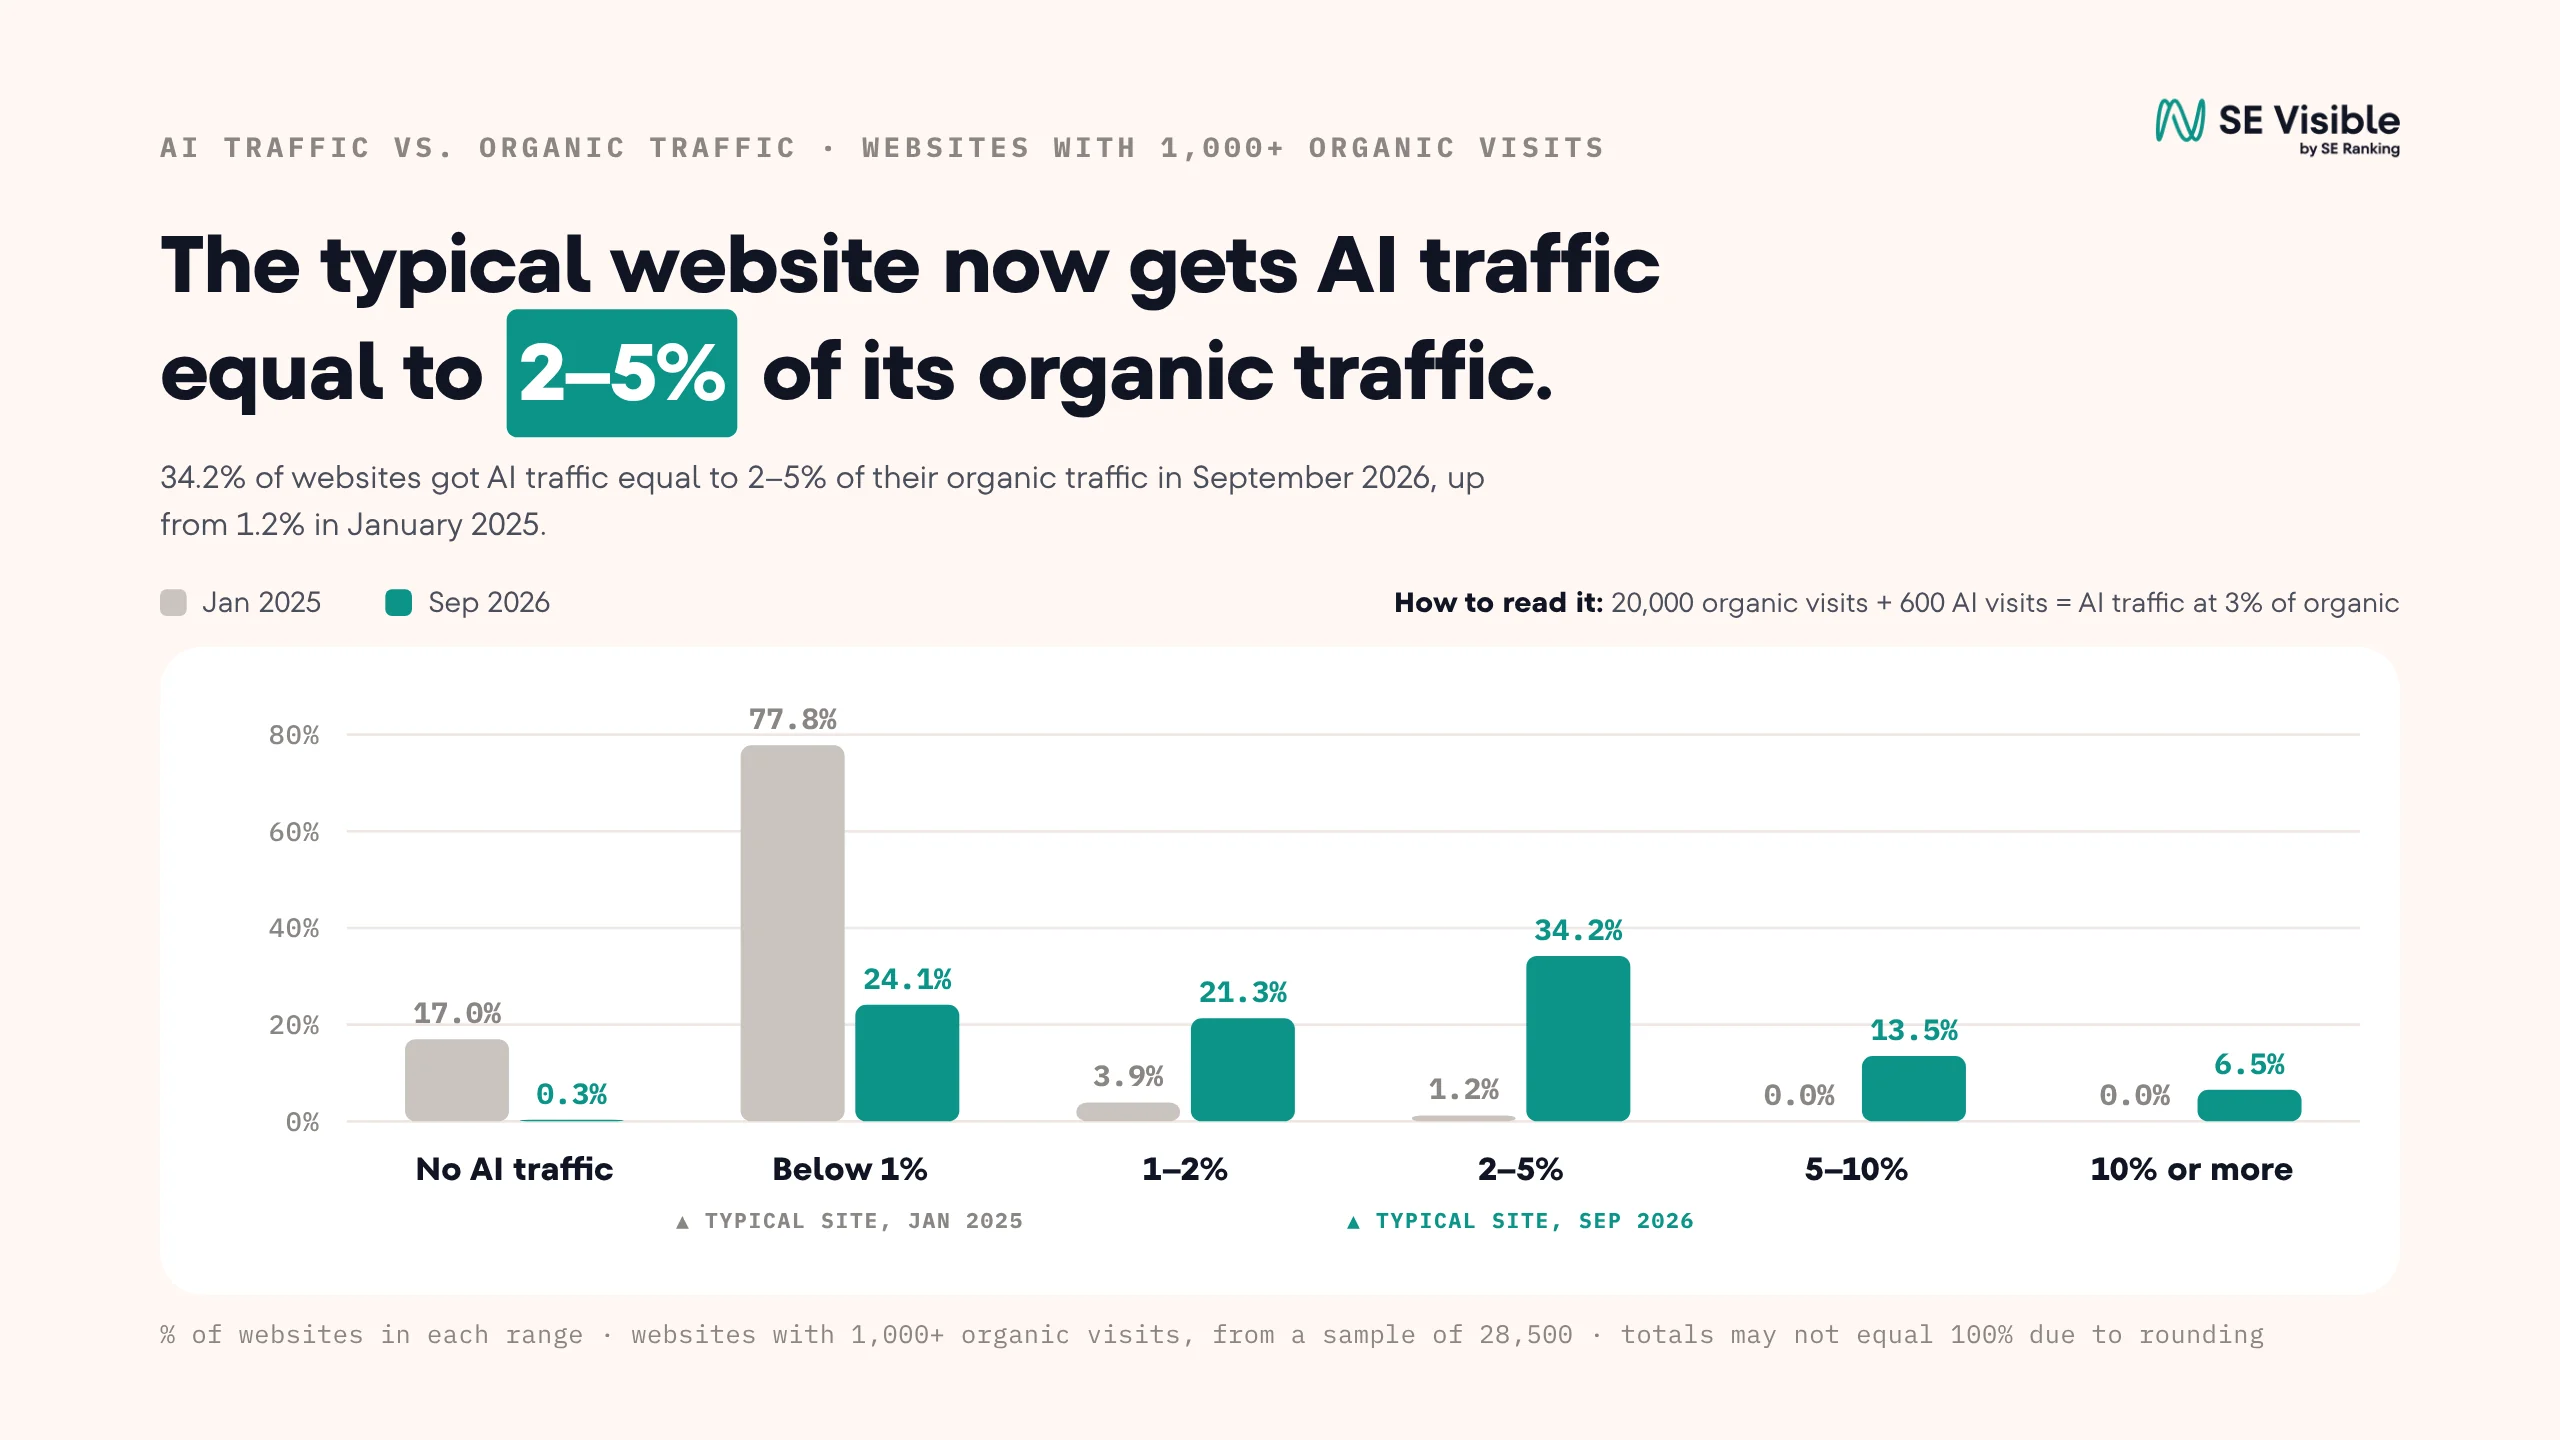
How many sites receive at least one AI visit?
Most of the sites studied received at least one such visit. The share was particularly high among sites that already attracted substantial organic search traffic. Growth was not even throughout the study period.
- In January 2025, at the start of tracking, 39.7% of sites received an AI referral. (SE Ranking / SE Visible, Nov 2026).
- In September 2026, 99.7% of sites with at least a thousand monthly organic visits also received an AI visit. (SE Ranking / SE Visible, Nov 2026).
- Between May and June 2026, the share of sites receiving an AI referral rose from 58.4% to 73.1%. (SE Ranking / SE Visible, Nov 2026).
The study only included sites receiving organic search traffic throughout the period. It therefore does not describe new sites or sites with no such traffic. The list of sites meeting the traffic threshold was also checked again each month.
When an AI visit reaches your site, record the referring system, the landing page and what the visitor did. Over time, you can see whether this traffic returns and whether it brings inquiries or purchases.
How large is AI traffic compared with organic search?
Check what each percentage is calculated from. SE Visible compares AI visits with organic search visits: visits from unpaid search results. Ahrefs measures each source's share of all traffic at the sites in its sample.
| Measure | Finding |
|---|---|
| A ratio of 2–5 AI visits per hundred organic visits | 34.2% of the larger-site group in September 2026, versus 1.2% in January 2025. (SE Ranking / SE Visible, Nov 2026). |
| At least one AI visit per hundred organic visits | 75.5% in September, versus 5.1% at the start. (SE Ranking / SE Visible, Nov 2026). |
| A ratio of 5–10 per hundred organic visits | 13.5% of the group in September. (SE Ranking / SE Visible, Nov 2026). |
| At least 10 per hundred organic visits | 6.5% of the group in September. (SE Ranking / SE Visible, Nov 2026). |
| Search engines in the Ahrefs sample, October 2026 | 27.55% of traffic. (Ahrefs, Nov 2026). |
| Google in the same sample | 24.74% of traffic. (Ahrefs, Nov 2026). |
| ChatGPT in the same sample | 0.36% of traffic. (Ahrefs, Nov 2026). |
| Change in visitors from Claude versus the previous month | Up 75.9%. (Ahrefs, Nov 2026). |
| Change in visitors from Gemini versus the previous month | Down 30.8%. (Ahrefs, Nov 2026). |
The first part compares AI visits with organic traffic alone. The second uses all measured traffic as its base. Some categories also overlap: Google is already included in search engines. Do not add the percentages in this table.
Do visitors from AI convert and generate more revenue?
At the retail sites Adobe studied, AI visitors bought at a higher rate and generated more revenue per visit. Adobe measured both website behavior and what consumers said in a survey:
- In August 2026, engagement for AI traffic was 16% higher than for other traffic, in relative terms. (Adobe Digital Insights, Sep 2026).
- The add-to-cart rate was 32% higher, in relative terms. (Adobe Digital Insights, Sep 2026).
- AI traffic to retail sites grew by 127% compared with the previous August. (Adobe Digital Insights, Sep 2026).
- In the September survey, 66% agreed that generative AI provides accurate results. (Adobe Digital Insights, Sep 2026).
- 38% said they trusted AI more than before. (Adobe Digital Insights, Sep 2026).
- Among people using AI to shop, 77% reported greater confidence in a purchase after using an assistant. (Adobe Digital Insights, Sep 2026).
- 69% of that shopper group said they were less likely to return a product bought with AI's help. (Adobe Digital Insights, Sep 2026).
The returns figure describes what shoppers said, rather than actual returned products. The data also does not prove that AI itself caused more purchases. If you sell software or services, check how many qualified inquiries, trial starts and purchases this channel brings to your business.
How are online mentions related to brand visibility in AI?
To understand why a brand appears in an AI answer, look at what is written about it across the web. These studies examine that relationship and the pages that systems link to. A relationship between two things does not prove that one causes the other.
Which types of mention are linked to appearances in AI answers?
Ahrefs found that brands mentioned more often online also tended to appear more often in AI answers. It studied US brands and questions that did not name those brands. The study was published in November, but does not give the exact data-collection dates.
| Comparison | Finding across the systems combined |
|---|---|
| Webpage mentions versus AI-answer mentions | Spearman correlation of 0.70. (Ahrefs, Nov 2026). |
| Mentions in news articles | 0.67. (Ahrefs, Nov 2026). |
| YouTube mentions | 0.64. (Ahrefs, Nov 2026). |
| TikTok mentions | 0.60. (Ahrefs, Nov 2026). |
| Ten times as many webpage mentions | Associated with about 3.7 times as many AI mentions. (Ahrefs, Nov 2026). |
| Ten times as many Reddit mentions | Associated with about 5.5 times as many AI mentions. (Ahrefs, Nov 2026). |
Correlation describes how closely the measures move together. It does not mean that adding mentions will deliver the same increase in AI answers. A large, familiar brand may attract more of both. The study counted only Reddit threads found in Google results, and excluded the brand's own site from its web-mention count.
How much do news and external sources contribute?
It depends on the system. Meltwater found that news sources' share fell in one system and rose in others within the same month.
| Measure in October 2026 | Finding |
|---|---|
| News and editorial sources' share in Perplexity | 39.2% in the first half; 29.5% in the second. (Meltwater, Nov 2026). |
| The same share in ChatGPT | 23.5%, then 23.9%. (Meltwater, Nov 2026). |
| The same share in Claude | 29.0%, then 29.7%. (Meltwater, Nov 2026). |
| AI Overviews' share of YouTube citations in the sample | 64%. (Meltwater, Nov 2026). |
| AI Overviews' share of Facebook citations | 75%. (Meltwater, Nov 2026). |
| Perplexity's share of Yahoo citations | 61%. (Meltwater, Nov 2026). |
| Claude's share of Wikipedia citations | 43%. (Meltwater, Nov 2026). |
The YouTube, Facebook, Yahoo and Wikipedia rows start with the cited site: of all links to that site, what share came from each AI system? That differs from asking what share of a system's sources were news sites. Meltwater also expanded its question list in October, so these results cannot be compared directly with its September report.
Which pages on a brand's website become sources?
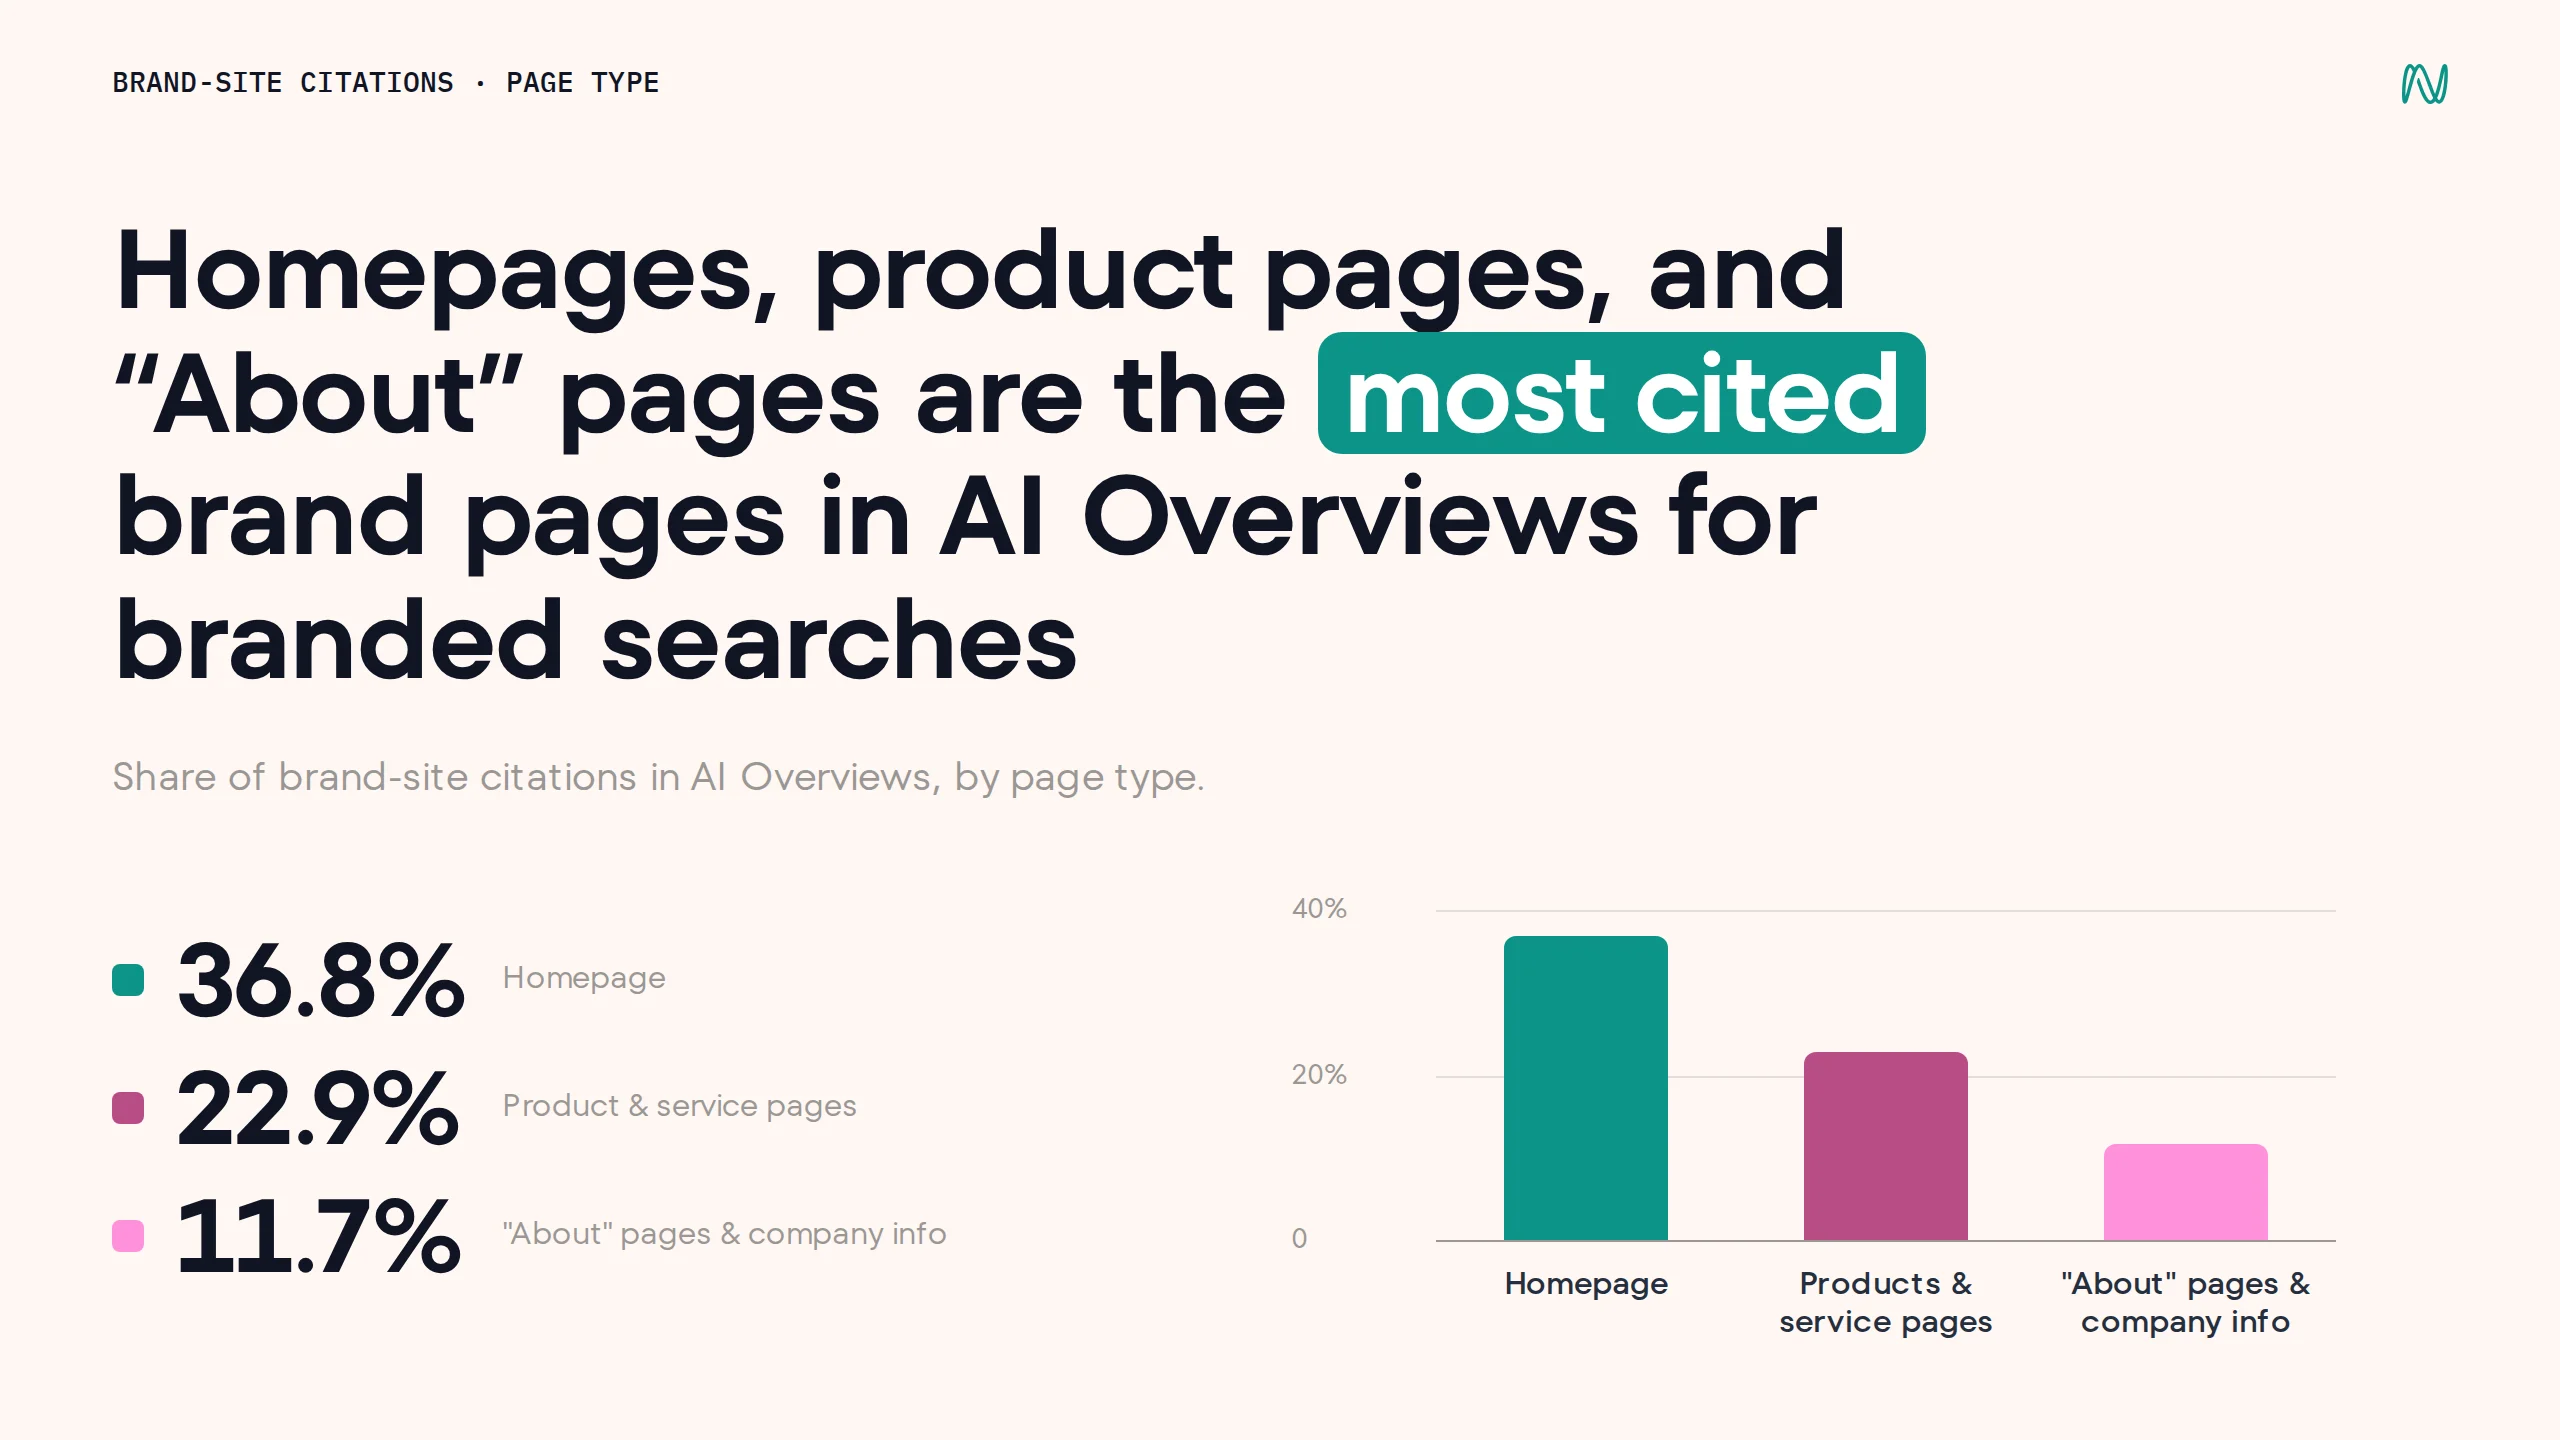
Product, about and support pages appeared as sources too. SE Visible checked which brand-site pages appeared in AI Overviews and compared them with pages in the top ten US organic results.
| Page type | Share of brand-site links in AI Overviews, versus organic results |
|---|---|
| Homepage | 36.8% versus 71.1%. (SE Ranking / SE Visible, Oct 2026). |
| Product, service and category | 22.9% versus 6.1%. (SE Ranking / SE Visible, Oct 2026). |
| About and company information | 11.7% versus 3.8%. (SE Ranking / SE Visible, Oct 2026). |
| Support and documentation | 4.3% versus 2.9%. (SE Ranking / SE Visible, Oct 2026). |
| Pricing and plans | 1.8% versus 0.2%. (SE Ranking / SE Visible, Oct 2026). |
- On average, 2.57 brand pages appeared in AI Overviews, versus 1.72 in the organic top ten. (SE Ranking / SE Visible, Oct 2026).
- 40.5% of all AI Overview citations in the US brand searches went to brand-managed sources, including websites, app stores and business profiles. (SE Ranking / SE Visible, Oct 2026).
These percentages describe the mix of pages selected from brand websites. They do not give the probability that your page will be selected. Review your product, pricing and about pages to make sure the information is clear and current. This is a useful starting point for improving how your business appears in AI answers.
How stable are AI visibility and citations over time?
To see whether your brand keeps appearing, repeat the same questions. Save the date and answer, and record whether the brand was named and whether a website link appeared too.
Will a citation seen today still be there tomorrow?
Not always. Ahrefs tracked whether websites cited on the first day appeared again over twenty days. Sometimes the site remained but the link pointed to a different page on it. The study was published in October without dates for its main tracking period.
| System | What happened to first-day citations |
|---|---|
| AI Overviews | 50% were absent the next day; 6.6% appeared on every tracking day. (Ahrefs, Oct 2026). |
| AI Mode | 58% were absent the next day; 6.8% appeared on every day. (Ahrefs, Oct 2026). |
| Gemini | 81% were absent the next day; 0.2% appeared on every day. (Ahrefs, Oct 2026). |
| Copilot | 83% were absent the next day; 0.5% appeared on every day. (Ahrefs, Oct 2026). |
| ChatGPT | 4.0% appeared on every tracking day. (Ahrefs, Oct 2026). |
If your link disappears, check what changed in the answer. Did another source replace it? Are there no links at all? Is your brand still named? The study also counted answers with no sources, so a link missing from one check has not necessarily disappeared for good.
How long does it take for a page's citation share to halve?
Profound measured when a page's share of source links fell to half its peak. Each page was measured separately in each system, from September 2025 to September 2026. A page appearing in several systems therefore had several results.
- For 78% of page-and-system pairs with enough follow-up, the page's share fell to half its peak within two weeks. (Profound, Sep 2026).
- Among pages that stayed above half their peak for longer than two weeks, median time to the decline was 27–29 days. (Profound, Sep 2026).
- Starting the clock at the first citation gave a median of 42 days until the share fell to half its peak. (Profound, Sep 2026).
- Among pages staying above half their peak for longer than two weeks, those cited in Claude were 2.8 times as likely as those in ChatGPT to remain there after eight weeks. (Profound, Sep 2026).
- Pages cited by at least five systems were 5.5 times as likely to retain half their peak share after eight weeks as those cited by one. (Profound, Sep 2026).
- In the same sustained group, citations were spread across weeks before the peak for 62% in Perplexity and 63% in Claude. (Profound, Sep 2026).
To reduce daily swings, the researchers averaged values across several days and counted only a lasting drop. The finding does not mean that an article has become outdated or needs republishing. Update a page when its information changes or it lacks an answer readers need.
Why measure each platform separately?
Each system can choose different sources and change how many links it displays. A decline in one system does not tell you what is happening in the others.
- Profound found little relationship between how long a page stayed visible in different systems: correlations were 0.03–0.09. Between Google's systems, they were 0.12–0.17. (Profound, Sep 2026).
In Ahrefs' stability study, these were the shares of answers with no citations:
| System | Answers without sources |
|---|---|
| Gemini | 64%. (Ahrefs, Oct 2026). |
| Copilot | 53%. (Ahrefs, Oct 2026). |
| ChatGPT | 0.7%. (Ahrefs, Oct 2026). |
| AI Overviews | 0.9%. (Ahrefs, Oct 2026). |
| AI Mode | 0.5%. (Ahrefs, Oct 2026). |
- Meltwater recorded a decline in Gemini from about 9.8 to 3.7 sources per answer from mid-October 2026. (Meltwater, Nov 2026).
- In Perplexity, it recorded a cap of 10 sources from early that month, compared with about 24 previously. (Meltwater, Nov 2026).
You can start with the AI visibility worksheet. Choose questions customers actually ask and repeat them over time. In each check, record whether the brand was mentioned, whether a link was included, and whether the answer was accurate.
Methodology and Sources
The article includes 102 references beside findings drawn from 11 original documents. A single study can contribute several findings. We opened the sources and checked that each number appeared there, what it referred to and when it was measured. The accompanying inventory has a record for each finding. The date beside each link is the source's publication or update date; measurement periods appear in the text and source notes below.
Download the inventory of 102 findings and sources.
We checked the numbers against the original publications, but did not receive the raw data or repeat the calculations. Most sources are studies by commercial companies. The experiment was published as a preprint. Two Ahrefs studies do not state when their data was collected; that limitation is noted beside them.
To keep this page current, the sources should be checked monthly and figures replaced when new research becomes available. The check date at the top records when this version was reviewed.
Terms used in this article
| Term | Meaning here |
|---|---|
| GEO | Work intended to help a brand and its content appear accurately in AI answers. |
| AEO | Writing content that answers questions clearly so search systems can use it. |
| AIO / AI Overviews | AI summaries integrated into Google's search results. |
| AI Mode | Google's conversational search experience, measured separately from AI Overviews. |
| CTR | The share of searches or impressions leading to a click, as defined by each study. |
| Relative change / percentage points | Relative change divides the difference by the starting value; percentage points are the direct difference between two rates. |
| Mention / citation / referral | A brand name in the text; a source linked in an answer; and a visit arriving at a website. These are separate measures. |
| RPV | Revenue per visit, as defined by the measurement tool. |
| SMB / mid-market / enterprise | Business-size groups as classified by each study; thresholds may differ between sources. |
| ITT / LATE | Two experimental estimates: ITT compares groups as originally assigned; LATE estimates the effect among people whose search experience changed because of the intervention, under the study's assumptions. |
| Spearman correlation | A measure of whether things tend to rise and fall together in rank. It does not show that one causes the other. |
| Citation half-life | Time from the peak to a sustained fall to half the citation share, under the study's definition. |
What each study covers
S1 · Semrush: Published 21 October 2026. The same 400 searches were checked monthly from September 2025 to August 2026, on US desktop across banking, software and ecommerce. This selected list does not represent all Google searches.
S2 · SE Ranking / SE Visible: Published 22 October and updated 12 November 2026. A thousand brand searches in each country were checked three times in October. Source analysis covered 827 US answers and 405 German answers. Organic results excluded the sitelinks below a main result.
S3 · Wang et al.: Released as an arXiv preprint on 18 August 2026; peer review was not verified. The study had 1,100 active participants recruited on 17–19 March. Three baseline days preceded a week of changed search experience. AI Mode results use assignment to a group (ITT). Estimates for hiding summaries adjust for the intervention not always working (LATE); the glossary explains these terms.
S4 · Ahrefs: Published 16 September 2026. Google Search Console data covered 963 websites in the French market, for 28 days before 22 July and nine days after it. In the high-exposure group, AI Overviews appeared in more than 20% of searches; in the low-exposure group, fewer than 2%.
S5 · SE Ranking / SE Visible: Published 12 November 2026. Tracking ran from January 2025 to September 2026 and included only sites with organic traffic every month. The group with at least a thousand monthly organic visits was reassessed each month. The source does not explain visit measurement in enough detail for a direct comparison with another analytics tool.
S6 · Ahrefs: Checked 15 November 2026, when the page showed its latest update as 14 November. The October data covers 118,671 sites using Ahrefs Web Analytics. Some traffic categories overlap, so their percentages must not be added.
S7 · Adobe Digital Insights: A September 2026 report. This article uses observed August data from US retail sites and a survey of 5,000 consumers conducted on 9–16 September. Holiday forecasts are excluded. AI findings are on PDF pages 19–23; the printed page numbers are one higher.
S8 · Ahrefs: Published 3 November 2026. The study covered 10,000 US brands and 260 million questions without brand names. Exact collection dates are not stated. Mention counts depend on the company’s databases and how it matched brand names.
S9 · Meltwater: Published 13 November 2026. The comparison is 1–15 October versus 16–31 October, covering about 120,000 questions, 12.7 million answers and 88.6 million citations across eight systems. Answer counts and question types differ between systems. The question list was expanded compared with earlier reports.
S10 · Ahrefs: Published 29 October 2026. The main study tracked about 37,500 citations daily across five systems for twenty days. Tracking dates were not stated. An answer with no sources also counted as a day on which a source was absent.
S11 · Profound: Published 30 September 2026. The study covered 1,188,816 page-and-system pairs from 8 September 2025 to 8 September 2026. It used a 14-day moving average and counted a fall to half the peak only if it lasted 14 days. Pages that had not fallen by the end remained in the analysis, with their unfinished follow-up taken into account.
Sources & further reading
Sources checked on
- AI Overviews have nearly doubled across five commercial search modifiers ↗
- AI Overviews appear on 82.5% of US brand searches ↗
- AI in Search Reduces Publisher Referrals Without Improving User Experience: Experimental Evidence ↗
- AI Overviews Cut CTR by 23.1% in France ↗
- Nearly 80% of websites now get AI traffic ↗
- AI vs Search Traffic Analysis ↗
- 2026 U.S. Holiday Forecast ↗
- Which Types of Mentions Correlate the Strongest With AI Visibility? ↗
- AI search visibility report for October 2026 ↗
- How Stable Are AI Citations? 10 Things We Learned Tracking 37,500 Citations ↗
- The half-life of an AI citation is 11 days ↗
How this article was created
- AI involvement
- AI-assisted drafting
- Recorded tools
- Codex
- Documented human contribution
- Nir approved the outline, requested a simpler tone, and approved the revised Hebrew article and publication in both languages. Research, drafting, translation and source checks used AI; no independent human fact-check was documented.
- Translation
- AI-assisted translation